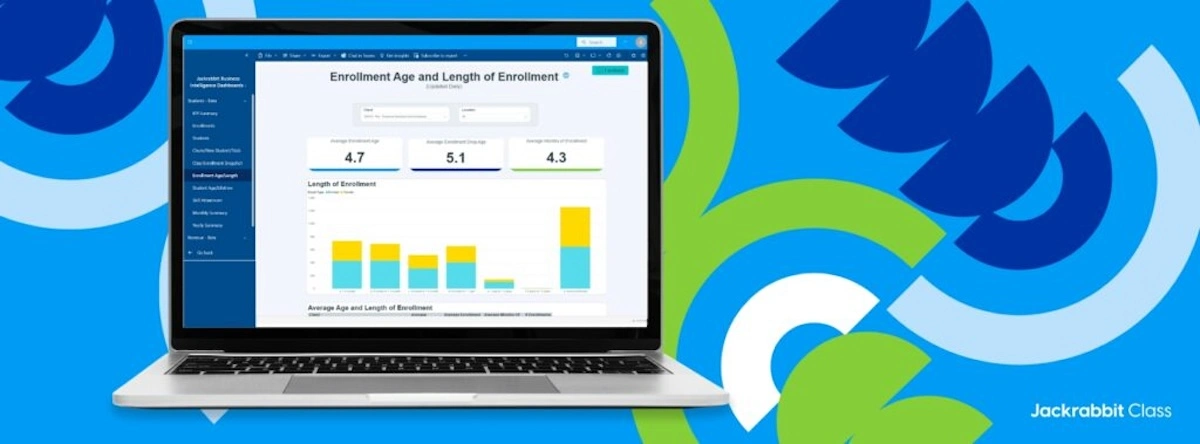
Here at Jackrabbit Class, we support youth activity centers of all sizes when you look at the number of students, locations, and staff members. And as an owner of a gym, swim school or dance studio, you need transparency into the health of your business at any given time.
From key performance indicators (aka KPIs) to spotting seasonal trends and everything in between, being able to easily assess the success of your program at your convenience is exactly what you need to continue moving your business in the right direction – growth from data-driven decisions!
That’s where the Jackrabbit Class Business Intelligence Dashboard comes into play, but first, let’s start with the benefits of business intelligence reporting.
What are the benefits of Business Intelligence reporting
With a large footprint in the youth activity industries and connections with impactful industry influencers, Jackrabbit knew that business intelligence reporting was more than a temporary buzzword.
In today’s instant gratification type of world, having access to accurate and timely metrics at any time is essential. This level of reporting can be used to identify and assess trends, compare different programs, and help you make meaningful decisions across many areas of your gym, swim school, or dance studio.
Interested in what KPIs you can measure with our business intelligence reporting?
Learn More About the Business Intelligence Dashboard
5 things to know about Jackrabbit’s Business Intelligence Dashboard
Jackrabbit’s Business Intelligence Dashboard was released earlier this year and is a suite of dashboards and tables powered by the Microsoft Power BI tool. These dashboards dive into available data so owners can view important KPIs over a specified period of time. The reports are extremely flexible with a number of filters, making the experience customizable by the user.
Let’s visit the top 5 must-know facts about Jackrabbit’s latest innovative feature!
1. Who should have access to the Business Intelligence Dashboard?
Having access to data is a dream come true. However, if you don’t know how to interpret the data, you might feel more overwhelmed than informed. That’s why it’s important to make sure the right person from your youth activity center has access to the Business Intelligence Dashboard – someone who can analyze the data, drill into the specifics if needed, and interpret the story the data is telling.
If you, as the owner, are not a data-head, then make sure the person you nominate is one you trust with sensitive information about your youth activity center.
2. How is data presented in the Business Intelligence Dashboard collected?
All of the data and information that is presented in the Business Intelligence Dashboard is collected from what is entered in your Jackrabbit account. Everything from family and student data to class and staff data is synced to the embedded Dashboard and produced into graphs and tables.
As the saying goes – garbage in equals garbage out. Being intentional about data input and ensuring checks and balances are in place will yield the best results for you and your team to take action on!
3. How were KPIs selected for the Business Intelligence Dashboard?
As with any new feature that’s meant to make things quicker and easier, we want to make sure we get it right as much as we can from the very beginning. There’s no better way than to give early access to clients who need it the most!
We conducted a large beta test with a feedback survey to determine which KPIs were most important so that the development could be prioritized accordingly.
4. How is the Business Intelligence Dashboard different from Jackrabbit’s reports?
Every Jackrabbit client gets access to a plethora of financial and enrollment reports with their subscription so what makes the Business Intelligence Dashboard different?
Many Jackrabbit clients have multiple businesses and while each Jackrabbit account can host unlimited locations, there are many scenarios where clients have separate accounts for various reasons, such as tax rates varying from state to state and different owners for each franchise or enterprise location. For these businesses in particular, the Business Intelligence Dashboard is #priceless – this is the only central location where all associated Jackrabbit accounts can be compared side by side without pulling multiple reports and logging into multiple accounts.
“I’m really loving the information provided in the Business Intelligence Dashboard. This is the type of info that not only helps me better understand and help my franchisees but also gives me great information to be able to sell to potential franchisees.” – Franchise CEO, Gideon Math & Reading
5. Is the Business Intelligence Dashboard included in the monthly subscription?
Starting in 2023, we dropped our top pricing tier to $245 for unlimited students (3,001+) and locations to help our clients scale their businesses and remain competitive in the market. Included in this unlimited tier is complimentary access to the Business Intelligence Dashboard. Best part is, there’s no need for a Power BI license or a Microsoft 365 subscription!
For clients that have less than 3,001 students, you too can have access to the Business Intelligence Dashboard. When you choose to ‘buy-up’, you pay $245 per month and gain better reporting, unlimited locations, and as many students as your youth activity center’s heart desires without the worry of lead filing. I’d say that is a big win-win!
In true Jackrabbit fashion, the Business Intelligence Dashboard will continue to evolve based on client usage and feedback. This tool is the key to any youth activity center owner’s success when it comes to keeping a pulse on the business and scaling for growth. Looking to implement class management software for your youth activity center so you can start benefiting from powerful reporting for your business?
Get started with Jackrabbit Class for free today


